
Have you ever wondered what sets professional photographers apart from amateurs when it comes to achieving that perfect exposure in their photos? The answer lies in a powerful tool that often goes unnoticed by many beginners but is a secret weapon for the experts. It's called a histogram, and in this post, we're about to unravel its mysteries. So, what is a histogram in photography?
Join us on this journey to discover the key to elevating your photography skills to the next level!
Histogram Photography Definition

Now that we've piqued your curiosity let's dive into the world of histograms in photography!
A histogram, in the context of photography, is like a graph that shows how bright or dark different parts of your image are. It's a way to understand the light and colors in your picture. Imagine it like a map of your photo's brightness.
Understanding histograms is super important in photography. Don't worry; it's not as complicated as it sounds! These graphs might seem tricky at first, but they're your secret weapon. They help you see if your picture is too dark, too bright, or just right. So, let's keep going and uncover how histograms can make your photos look amazing!
What Does a Histogram Look Like?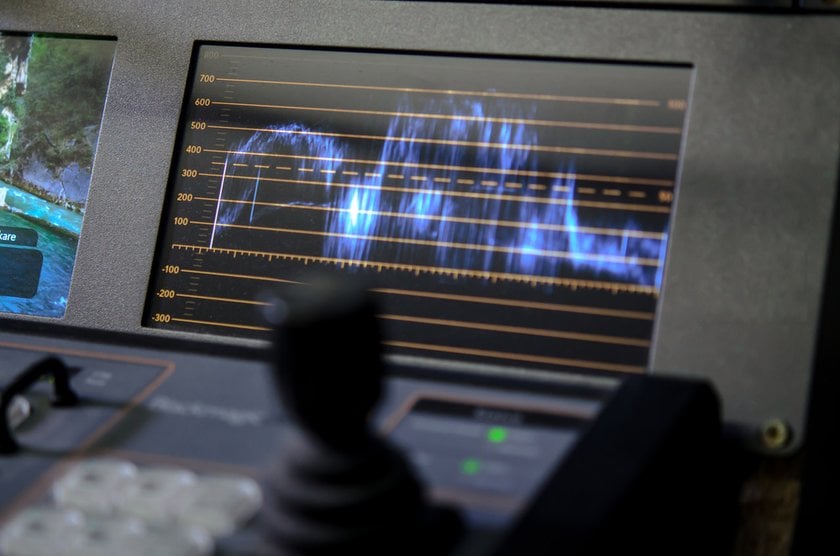

Now that you're familiar with the term "histogram," let's get to know it better! A histogram may sound fancy, but it's like a visual report card for your photo. It helps you understand how bright or dark your image is and can tell you a lot about its overall exposure!
Advanced yet easy-to-use photo editor
Get Luminar Neo NowThink of the histogram as a two-dimensional chart:
Horizontal Axis: This axis shows the range of brightness levels in your picture, from the darkest on the left to the brightest on the right. It's like a scale of brightness.
Vertical Axis: Here, you'll see the number of pixels in your photo that have a particular brightness level. It's like counting how many pixels are at each brightness level.
Histograms come in various shapes, and each shape tells you something essential about your image:
Underexposed Histogram: If most of the data is bunched up on the left side (the dark end) of the chart, it means your photo is underexposed. In simple terms, it's too dark.
Overexposed Histogram: When the data is crowded on the right side (the bright end), your photo is overexposed. This means it's too bright, and you might lose details in the bright areas.
Balanced Histogram: The ideal histogram is a balanced one. It means that the data is spread out evenly across the chart, covering both dark and bright areas. This indicates a well-exposed picture.
Understanding these different shapes is like knowing the secret language of your photo's exposure. It helps you see if your picture needs some adjustments, and we'll explore how to do that shortly. So, let's continue our journey of demystifying histograms!
Practical Application in Photographs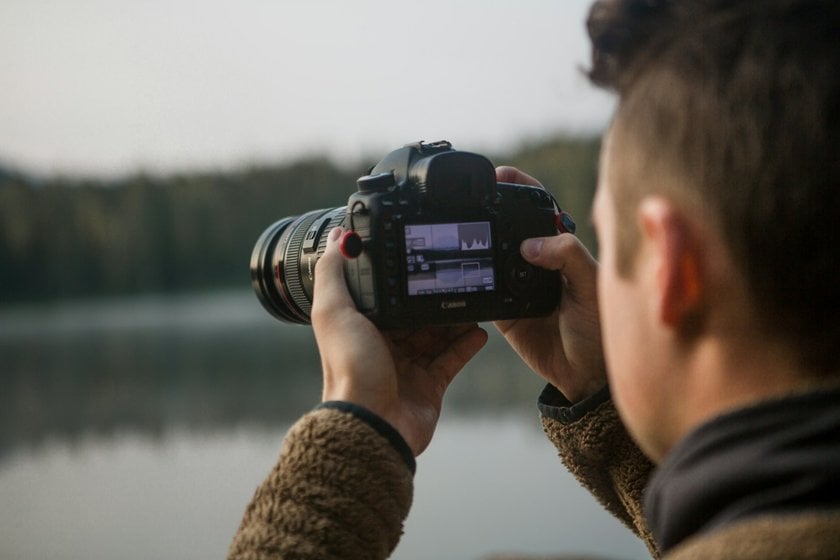

A histogram is like a superhero tool for photographers! Here's how you can use it to make your photos amazing:
Adjusting Camera Settings: When you're taking a photo, peek at the histogram on your camera's screen. If it looks lopsided, like a mountain falling over, it's a sign your picture might be too dark or too bright. Here's the trick: if it's too dark, let more light in by doing things like opening the camera's eye (aperture) or slowing down the blink (shutter speed). If it's too bright, do the opposite.
Imagine you're catching a stunning sunset. The histogram helps you get that golden glow just right. You can make changes on the spot to capture the beauty!
Tips for Different Lighting: Histograms come to the rescue in tricky lighting. Bright sun or dark shadows won't stump you anymore. Adjust your settings based on the histogram to snap fantastic photos, no matter the light.
Imagine you're in a cozy room with low light, and you want to capture a special moment. The histogram hints that your image might turn out too dark. With the histogram's help, you can let in more light, keeping the mood intact.
In simple terms, understanding histogram photography is like having a powerful asset to enhance your photos. It's a tool that professional photographers appreciate, and now it's your turn to utilize it. So, as you delve into photography, always keep an eye on that histogram. It's your key to capturing remarkable images, whether you're capturing nature's beauty, preserving cherished moments, or perfecting your photographic skills!
Exclusive Tools of Endless Possibilities in One AI Editor
EXPLORE NOW!Enhance Your Photos Easily with Luminar Neo
If you're into photography and have heard of a histogram, you'll know it's all about getting the right light and color in your pictures. Luminar Neo is a cool tool that can help you make your photos look even better! It's great for making the colors in your photos really stand out. This is called increasing the color intensity of an image, and it's a big deal if you want your pictures to look more lively and colorful. Luminar Neo is super easy to use, so even if you're new to editing photos, you'll find it really helpful!
What's really cool about Luminar Neo is that it's like having a magic wand for your photos. You can tweak the colors in your picture to make them look just right. If your image has colors that are too quiet or dull, you can pump them up so they're more fun to look at. And if you have any weird color shades in your photo that you don't like, this software can fix that, too. This all contributes to Luminar Neo being a picture quality enhancer, ensuring that each of your pictures looks its best!
The most amazing part about this platform is that it's an automatic photo editor. This means you don't have to be a pro to make your photos look awesome. Just move a slider here and there and watch your images transform. It's great for people who don't want to spend a lot of time editing but still want their pictures to look amazing! And if you have a bunch of pictures, you can edit them all at once, saving you a lot of time and effort. So, Luminar Neo is not just about making one photo look good; it's about making all your photographs look great with just a few clicks!
Bottom Line

Wrapping it all up, getting to know a histogram in photography is really helpful for anyone who loves taking pictures. It's like having a cheat sheet that shows you how bright or dark your photo is, which is super useful for getting your picture just right. And hey, if you're also curious about how to make sure all the different tones in your image look good together, which is called tonal balance in photography, or if you want more tips on how to read a histogram, we've got some cool posts about that, too. Check them out for more tricks to make your photos awesome!
Plus, if you're looking to add some extra oomph to your pictures, Luminar Neo is a neat tool to try. It's all about making the colors in your images pop and ensuring that each picture looks top-notch. It's super easy to use, even if you're just starting with photo editing!
Happy photographing!
